Disclaimer: everything written here is pure speculation by me based on what we already know about past and future AMD cores
Update : corrected some wrong figures towards the end of the post
Update #2: put the final estimates in concrete numbers,for all Zambezi models
Update #3: if you want to see my estimate for all desktop chips in 2011/2012,
I wrote a new blog covering this.
There has been a lot of rumors and fake data about Zambezi lately.One "blogger" seeded many websites with his rigged Zambezi results and had practically spread massive amount of FUD.Maybe he has some agenda? Anyway,I will try to dissect a few public statements and see what kind of performance levels we can expect from Orochi design in client(desktop) workloads.
Server Vs Desktop performance targets
 |
| One "bulldozer" module.Note the shared and dedicated parts. |
First thing that comes to mind when someone says "bulldozer performance" is AMD's server division statement of "50% more throughput performance than previous 12C MC products". Looking back in the past(Barcelona) and knowing the difference between server and client workloads,we can say with great certainty that those (server) figures are not representative of desktop performance. Server is all about throughput,where more cores usually scale nicely and where memory BW matters a lot. Interlagos ,a server product, will have 16 "Bulldozer" cores,grouped in pairs and arranged in so called modules(module is AMD's term that means "an optimized dual core" and it is a building block of Orochi design).It will be 2x8C design,a so called Multi Chip Module(different from AMD's "module" term) product,consisting of 2 Orochi dice linked together to create a 16C product.Since both Orochi dice are supporting 2 channel integrated mem. controller,this will give a 16C interlagos a total of 4 memory channels,2 per 8 core die. MCM technique gives AMD an opportunity to better match the cores that have similar real world power/perf. characteristics and cut the costs at the same time(imagine monolithic Interlagos with huge 4 channel IMC and 16cores on a massive 600+mm^2 die,yikes!- now compare it with 2 x ~290mm^2 for MCM Interlagos).
 |
| Concept behind one Orochi die.4 modules mean 8 cores.Interlagos will link 2 of these in MCM for a total of 16 cores. |
|
 |
| A great picture by Hans De Vries(http://chip-architect.com/). An actual(real) Orochi die shot.4 groups of modules,each of which has 2 cores.Note the die area savings due to "sharing philosophy".Huge L3 cache is partitioned in 4 groups of 2MBs.Each module also have shared L2 cache,2MBs in size. |
Back to "50% more throughput" statement.Since this is server statement we can't deduce much about desktop performance from it.We know that even though many server workloads scale nicely with more cores, some server workloads don't scale that well with core count.But we also know that Bulldozer will have very aggressive Turbo Core boost so it will adapt itself to this eventuality: up the clocks by 1Ghz and power/clock gate the idle parts in order to maximize
serial code performance in single or poorly threaded workloads;return from C6 state and clock up to default clock all cores if FPU intensive workloads use up all the cores in a system;clock up by 500Mhz all integer cores if all of them are running integer heavy workloads while FP units are clock gated .
So the "50% more throughput" statement is more of an average of many workloads(both integer and FP and both serial and parallel in nature-mostly parallel though).So with Interlagos we will have 33% more cores(1.33x) ,running at somewhat higher clocks(depending on the nature of workload) and having X% better IPC than Family 10h cores. I say "X% better IPC" because it is unknown by how much will IPC grow and also because we know it
will have higher IPC since AMD stated so(it can be even a few % for all we know but it would still be a true statement).
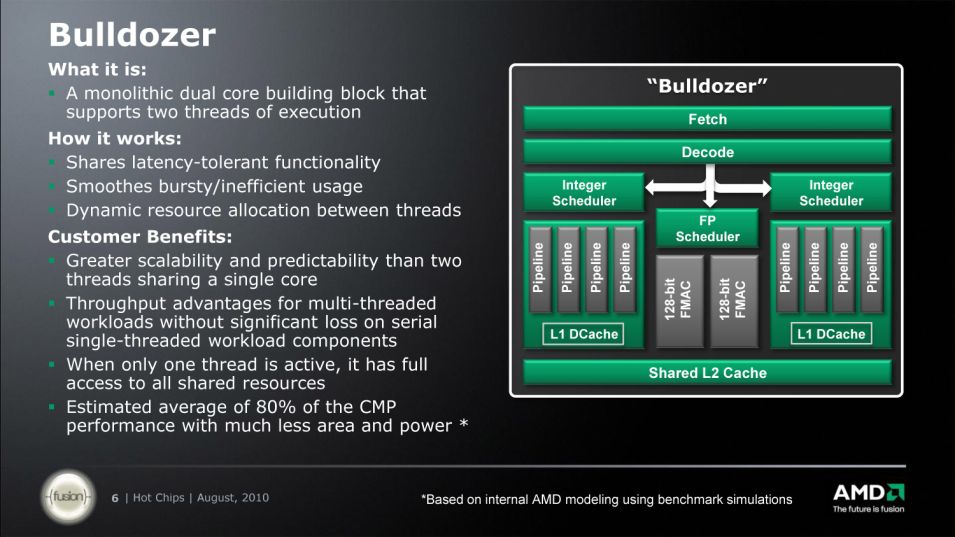 |
| 80% throughput performance of CMP approach with much less die area. |
This X% better IPC is a variable with Bulldozer,mainly due to 2 reasons.
First is the shared front end for which AMD publicly stated it offers 80% of throughput of conventional dual core
design(a hypothetical conventional Bulldozer dual core done "the old way").
 | |
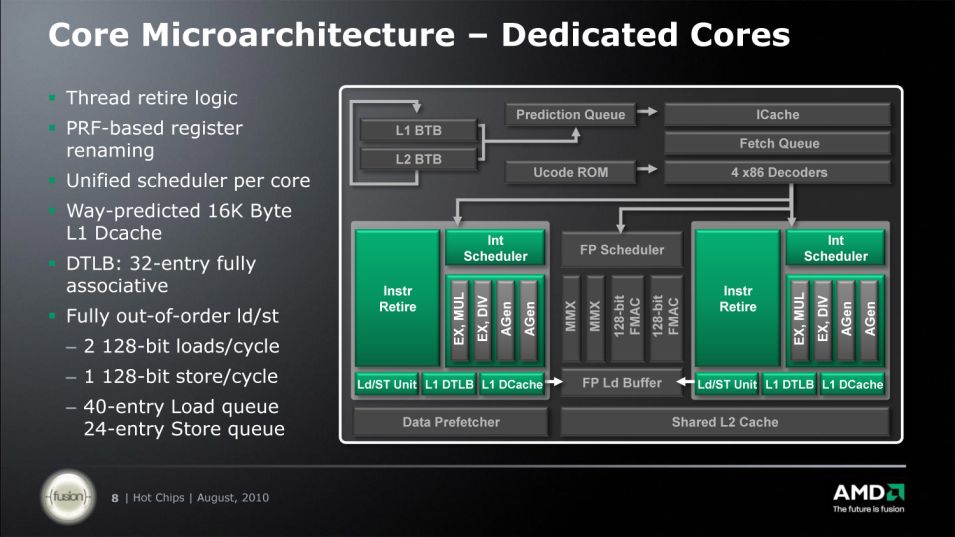
| Shared front end in Bulldozer module. |
Second is the new integer core design : 2ALU+2AGU with unified integer scheduler and other improvements Vs 3ALU/AGU design with separate math and address schedulers.
First reason (shared front end) will mean that if a Bulldozer(BD) module,which is an optimized dual core,has 100pts on average in a mix of parallel workloads(2 threads),each thread is somewhat penalized .This penalty probably varies a lot and can be as little as 1% or as much as 25%(or even more).AMD listed an average of 80% throughput(25% penalty) but we have to understand that no dual core product out there scales perfectly with more threads.Usually(for non-SMT dual cores) it is around 95% scaling .So essentially BD module is around 19% slower(95/80) due to this penalty but with a much less die area than hypothetical Bulldozer that was to be done "the old way". So each thread on its own (running solo in the module) is up to 19% "stronger" then when both of them run together.
Another thing to note is that sharing is not always bad ;).This is the case of floating point unit,which is shared between 2 integer cores within the module.
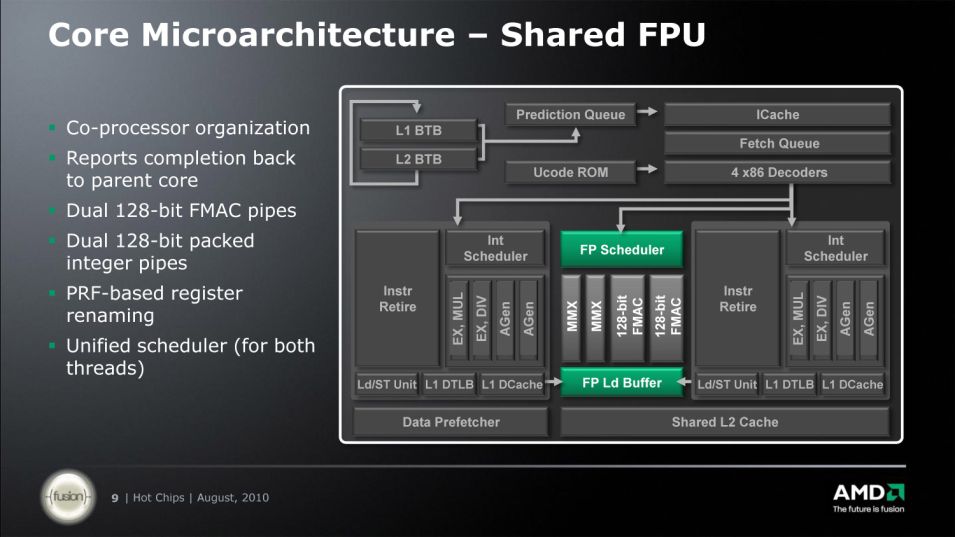 |
| BD module's FP unit organization. |
When integer cores may have this slight performance penalty ,the FP units that work in SMT mode in BD module may even see the boost from this type of operation. Bulldozer module has a so called FlexFP floating point unit.It consists out of 2 FMAC units that have unified scheduler.Practically we have one FMAC per integer core but note that one integer core can use both if opportunity arises(ie. single threaded SIMD workload).Each FMAC is fused multiply accumulate capable and is 128bits wide. It is estimated that ,performance wise, one 128bit FMAC will be roughly on par with one Family 10h "core" in previous MC products even though FMAC can do either/or ADD,MUL,FMA while one Family 10h core can do one ADD and one MUL (in theory).This is done via core optimizations(new L/S unit,new scheduler,improved reg-reg transfer rate). AMD estimated that 16C Interlagos(~2.5 or 2.6Ghz) will have around 63% better FP throughput performance than 12C 2.5Ghz Magny Cours.How do we know this you may ask?Well following slide is an AMD estimate back from the day when Magny Cours topped at 2.3GHz.
 |
| Chart made by HP and AMD in a presentation held back in 2010.All performance figures for Interlagos are estimates.Magny Cours performance based on 2.3Ghz model. |
If we correct for the speed bump of 2.3->2.5Ghz that Magny Cours saw in the mean time,the specfp_rate increase that comes with Interlagos(of 1.78x) will be lowered to around 1.63x. To be on the safe side lets say it's around 60% or 1.6x
* .So this gets us around ~20% improvement per core with Interlagos(1.6/1.33=~1.2 or 20%). In integer we see AMD estimated 50% improvement versus 12C 2.3Ghz MC ,but after correction for clock speed bump this is down to 38%.On average ,for both integer and fp,according to adjusted projected performance on above chart,Interlagos should give : sqrt(1.38x1.6)=1.485
or close to 50% more throughput than Magny Cours ,as AMD now claims.
*I assumed that Interlagos won't have lower starting clock speed at launch than 12C 45nm MC product(2.5Ghz top model).Interlagos clock speed may end up between 2.4Ghz and 2.6Ghz.
This improvement in fp_rate may be the effect of SMT execution inside the FlexFP.Since both FMACs operate inside the module in SMT fashion,they may see the boost of ~20% ,similar to the boost intel's Nehalem/SB cores see in threaded workloads from intel's own implementation of simultaneous multithreading. Note that with BD this will probably happen in FP heavy workloads that are multithreaded.In single threaded FP heavy workloads,one core can use both FMACs and that is 2x more floating point execution units(both FMACs) in single thread FP usage model.This could lead to very big performance uplifts versus Family 10h.
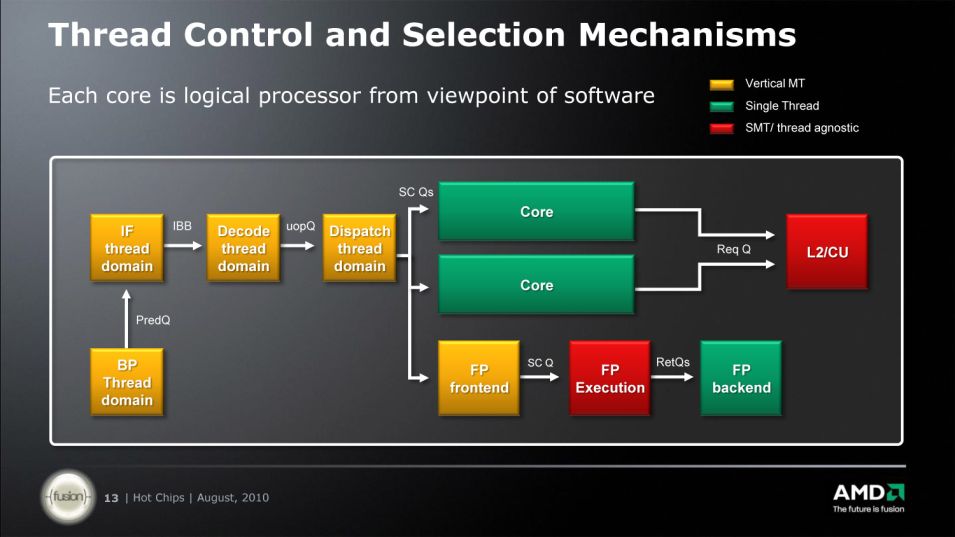 |
| Thread control/selection in Bulldozer module.Note the SMT organization for FP execution(red boxes,sorry for small image).This helps with hiding pipeline bubbles and may lead to improved FP multithreaded performance. |
Putting it all together we have : 50% better throughput performance with 33% more cores(improved cores) and around the same base clock with 500-1000Mhz Turbo on top of this base clock.According to the slide I've linked earlier (that represents AMD's rough performance estimate back in 2010),we have :
-
integer throughput
50% higher score than 2.3Ghz MC(90"pts" vs 60"pts"). In order to get to how much will Interlagos score (without the shared penalty) we have to figure out some variables. 1st ,adjust MC results for speed bump : 60x2.5/2.3~=65pts in specint_rate for MC 12C @ 2.5Ghz. Since scores don't scale perfectly with clocks,we have to adjust for ~4.5% (source spec.org and results for 12C MC @ 2.3Ghz and 12C MC @ 2.1Ghz in specint_rate;scaling is roughly equal to 2.2Ghz when we look at the results of 2.3Ghz MC 12C chip so 4.5% correction or 2.3/2.2=1.045). Final adjusted score for 12C MC @ 2.5Ghz : 65/1.045=
62.2 pts.
Now we need to estimate the effect of integer Turbo core in Interlagos score. Base is 2.5Ghz(top Interlagos model according to some leaks) ,maximum clock is 3.5Ghz(half cores idle).But for specint_rate we have 500Mhz boost on all integer cores since they are all loaded=> 1.2x or 20% .Again we correct for 4.5% since scores don't scale perfectly with clock speed(1.2/1.045=
1.15x or 15% Turbo effect). Sharing penalty is 25% or 1.25x(80% performance of CMP approach) but since we know that usually conventional CMP approach scales less than perfect(~95%),the sharing penalty is around ~19% or
1.19x(95/80). Also of interest is scaling with more cores in spec int rate tests.8C Magny Cours @ 2.3GHz in 4P configuration has 1.4x lower score than 4P 12C Magny Cours @ 2.3Ghz in this test(source: spec.org). This shows us that with 50% more cores we have roughly 40% higher score in specint_rate.With 33% more cores we will therefore have ~24% higher score in specint_rate test,or
1.24x. All summed up ,we get for Interlagos @ 2.5GHz : 90/1.15x1.19/1.24=75.1pts.
Very approximate improvement versus MC per core and per clock in integer workloads: 75.1/62.2=
~20%. If we leave 5% for margin of error we get ~14%. If Interlagos launches
at 2.6Ghz base clock then the improvement is down to 15% or with error margin at 9% .
All very rough approximation of course.
-
fp throughput
78% higher score than 2.3Ghz MC(154"pts" vs 86"pts"). In order to get to how much will Interlagos score we have to figure out some variables. 1st ,adjust MC results for speed bump : 86x2.5/2.3~=93.5pts in specfp_rate for MC 12C @ 2.5Ghz. Since scores don't scale perfectly with clocks,we have to adjust for ~4.5% (source spec.org and results for 12C MC @ 2.3Ghz and 12C MC @ 2.1Ghz in specfp_rate;scaling is roughly equal to 2.2Ghz when we look at the results of 2.3Ghz MC 12C chip so 4.5% correction or 2.3/2.2=1.045). Final adjusted score for 12C MC @ 2.5Ghz : 93.5/1.045=
89.5 pts.
In FP heavy workloads there won't be any Turbo core available since TDP budget is exhausted . Base is 2.5Ghz(top Interlagos model according to some leaks) ,maximum clock is 3.5Ghz(half cores idle).For specfp_rate we have no Turbo core boost => so
1.0x .
As discussed before,in FP heavy workloads the SMT benefit may come into play. Now we have 8 FlexFP units running 16 threads across 16 FMACs (SMT is done 2way within each module;2 threads run simultaneously on 2 FMACs via unified FP scheduler in FP coprocessor ).So far lets leave this one out and we will return to it later.For final perf. equation SMT benefit is labeled as
Y.
Also of interest is scaling with more cores in spec fp rate tests.8C Magny Cours @ 2.3GHz in 4P configuration has 1.27x/1.3x(base) lower score than 4P 12C Magny Cours @ 2.3Ghz in this test(source: spec.org). This shows us that with 50% more cores we have roughly 30% higher score in specfp_rate with Magny Cours.With 33% more cores we will therefore have
~15.3% higher score in specfp_rate test,or
1.15x ,
<=this is the effect of 33% more cores in specfp_rate benchmark. All summed up ,
with unknown SMT benefit,we get for Interlagos @ 2.5GHz : 154/1.0x/1.15=
133pts. To figure out the SMT benefit we divide 133 with the score of MC @ 2.5Ghz which is 89.5 :
133/89.5=1.48 or
48% better per core. Since this may look like a huge jump in performance ,there may be a reason why Interlagos scores so well in FP rate : scaling with more cores is much better than with Magny Cours(which scales not so well in this MT floating point test suite). So if we take the perfect scaling with 33% more cores : 154/1.33=115pts. Now we have 115/89.5=
1.28 or 28% better "per core" ,which in turn may be the effect of Simultaneous Multithreading in FLexFP(since each FMAC on its own should be on par with each Magny Cours core,but working in SMT mode we have the boost similar to the boost intel's cores get from their SMT implementation).
Very approximate improvement versus MC per core and per clock in floating point workloads(serial and parallel ): Up to 30% in well threaded(parallel) workloads and more than that(probably >50%) in single threaded(serial) FP workloads. If Interlagos launches
at 2.6Ghz base clock then the improvement is down to ~25% "per" core in multithreaded workloads.
All very rough approximation of course.
How does all this relate to Desktop performance?
Above I've tried to speculate about how much effect will each aspect of Bulldozer design have on final (server) performance.Since many things are still blurry ,we don't know for sure how high is the core improvement(IPC) relative to Family 10h(K10).It may vary a lot but still it should be higher in the case of Bulldozer. Last March at Cebit event,AMD's John Taylor said in an interview for OCTV that
Bulldozer was designed to offer 30-50% more performance within same power envelope as previous design (2:20) (previous design is 125W K10 based 6C Thuban @ 3.3Ghz).Geometric mean of this wide performance range(30-50%) lands at 39.6%. Since I like to use
hardware.fr's average chart for performance comparisons, let's see where would Bulldozer land with ~1.38-1.39x better performance than 3.3Ghz Thuban(with Turbo enabled).
Chart looks like this:
38% (average) higher score would put 8C Zambezi at 165.8x1.38=229pts. In the review hardware.fr did when 1090T X6 launched they calculated the effect of 50% more cores in desktop workloads(and effect of Turbo that was really small since in AMD's case it kicks in with workloads that stress no more than 3 cores). So they found out that 1090T X6 @ 3.2Ghz is 24.5% faster than 955BE X4 @ 3.2Ghz. 50% more cores,24.5% higher performance in the chart. Let's see what kind of score we can get if we apply each Zambezi improvement on top of Thuban's base score.
Core count improvement: for Zambezi,this would mean 33% more cores than X6,
10.5% 16.7% higher performance in the chart. This would be the
"more cores effect" and is as expected because with more cores you get a lot less of performance boost since most desktop applications are not well threaded(they like faster cores,be it IPC or clock or combination).
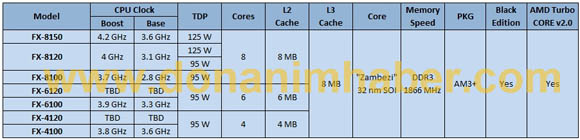
The Turbo effect in 8C Zambezi is equally hard to estimate. Latest rumors point to following models:
So we supposedly have top 8C model with 3.6GHz base clock and 4.2Ghz Turbo for half active cores(or up to half active cores;if 5th core is activated the max Turbo is lowered to some value below 4.2Ghz). Approximate effect of Turbo in desktop workloads(which are mostly poorly threaded):
geometric mean of 3.6 and 4.2GHz => 3.88GHz or 8% over default clock.This in turn is 14% above Thuban X6 @ 3.4Ghz.I used 3.4 instead 3.3Ghz in order to account for limited Turbo effect Thuban has from its own Turbo Core with 3 active cores. Since Zambezi will usually run above stock and close to the geom. mean value (~3.9Ghz) in most if not all desktop workloads,it's safe to say that
14% or 1.14x is approximate improvement that top Zambezi 8C model will see over Thuban 1100T @ 3.3Ghz .
Next is infamous
"IPC" or core improvement.Since I've spent a good deal on this topic in first part of this blog post,I will use the speculated results,although the "more conservative" variants :
integer ~10% per core ,
FP/SIMD 20% per core.In case of integer,~10% is just an average speculative single core improvement.There is a penalty when both threads run in the module(up to 19%).FP/SIMD benefits from sharing so there is no penalty here,but opposite effect. Geometric average between int and fp is
~14%. I decided to figure in the
0.9x figure as an average penalty factor that is applied to final Zambezi score.
All factors combined: Thubans score x ( 1.167x1.14x1.14x0.9)=165.8x1.364~=226pts in the chart above. Score of ~226 fits quite well with what John Taylor said and that is between 30 and 50% faster than previous AMD design while having the same TDP.If Zambezi really ends up being 38% faster than top Thuban(~229pts) it becomes the fastest desktop chip on the market,posting the same average score as intel's top desktop Westmere 6C product 990x.
My final estimate for 8C Zambezi at 3.6Ghz/4.2Ghz Turbo mode : 36-38% faster than 3.3Ghz 1100T Thuban. As you can see,this is
very different from server statement of "50% more throughput than current 12C products",even though the core ratio stays the same between appropriate server and desktop parts and is exactly 33% more cores.Note also that clock speed ratio is even higher in case of desktop Bulldozer models vs Thubans(3.6/4.2 Vs 3.3/3.7) when compared to clock ratio of server BD and Magny Cours parts(more even clock speeds of around 2.5Ghz for both).
Still,desktop will see lower increase in performance due to nature of workloads-more serial and less parallel in nature.
In the end,here is a quick estimate for Zambezi 6C and 4C models,assuming same clock speeds for both(3.6Ghz base for top 6C and 4C models):
Top Zambezi
6C 3.6Ghz/4.2GHz with Turbo : ~16.7% slower(effect of 33% more cores) on average than 8C 3.6Ghz/4.2Ghz model(229pts).Approx. chart result :
194-196pts <-
faster than 2500K
Top Zambezi
4C 3.8Ghz?/4.4GHz?(based on leaked info above) with Turbo : ~17% slower on average than 6C 3.6Ghz/4.2Ghz model. 17% is a combination of "less cores effect"(/1.24) and more clockspeed effect(x1.05).Approx. chart result :
165-166.5pts <-
faster than top end Thuban @ 3.3Ghz
If you have any comments or suggestions,please post them in the comments section.


